From Overthinking to Action: Week 1 of My Collaborative Elephant Conservation Data Visualization Platform
Search for a command to run...
No comments yet. Be the first to comment.
This series explores the weekly progress, and challenges I encounter during my journey building a collaborative data visualization platform for endangered species.
Hello everyone, and welcome back for week 2 of the collaborative data visualization platform project! This week brought a mix of exciting progress, a chance to delve deeper into responsible data use, and some valuable learning experiences. Laying the...
Hi everyone, It's been a few weeks since my last update, and I apologize for the delay. Sometimes life throws you a curveball, and the past few weeks have been one of those times. The conservation platform project had to take a backseat while I focus...

Hi everyone, Welcome back to week 5 of my ongoing project – a collaborative elephant data visualization platform! This week was a productive one, focusing on both user experience improvements and securing the data that will fuel the visualizations. L...
Hi everyone, and welcome back for week 4 of building my collaborative conservation platform! This week has been a whirlwind of progress, a detour that turned into an exciting opportunity, and some key milestones achieved. Let's dive in! Building a Us...

Hello again everyone, and welcome back for week 3 of building the collaborative elephant data visualization platform! This week has been a fascinating journey filled with progress, new learnings, and a few unexpected detours along the way. Authentica...
Hello everyone, and welcome back for week 2 of the collaborative data visualization platform project! This week brought a mix of exciting progress, a chance to delve deeper into responsible data use, and some valuable learning experiences. Laying the...

Hey everyone! This blog marks the official start of a new adventure. I’ll be documenting the creation of a tool to visualize conservation data and enable collaborative efforts.
Hitting the Wall Before Takeoff
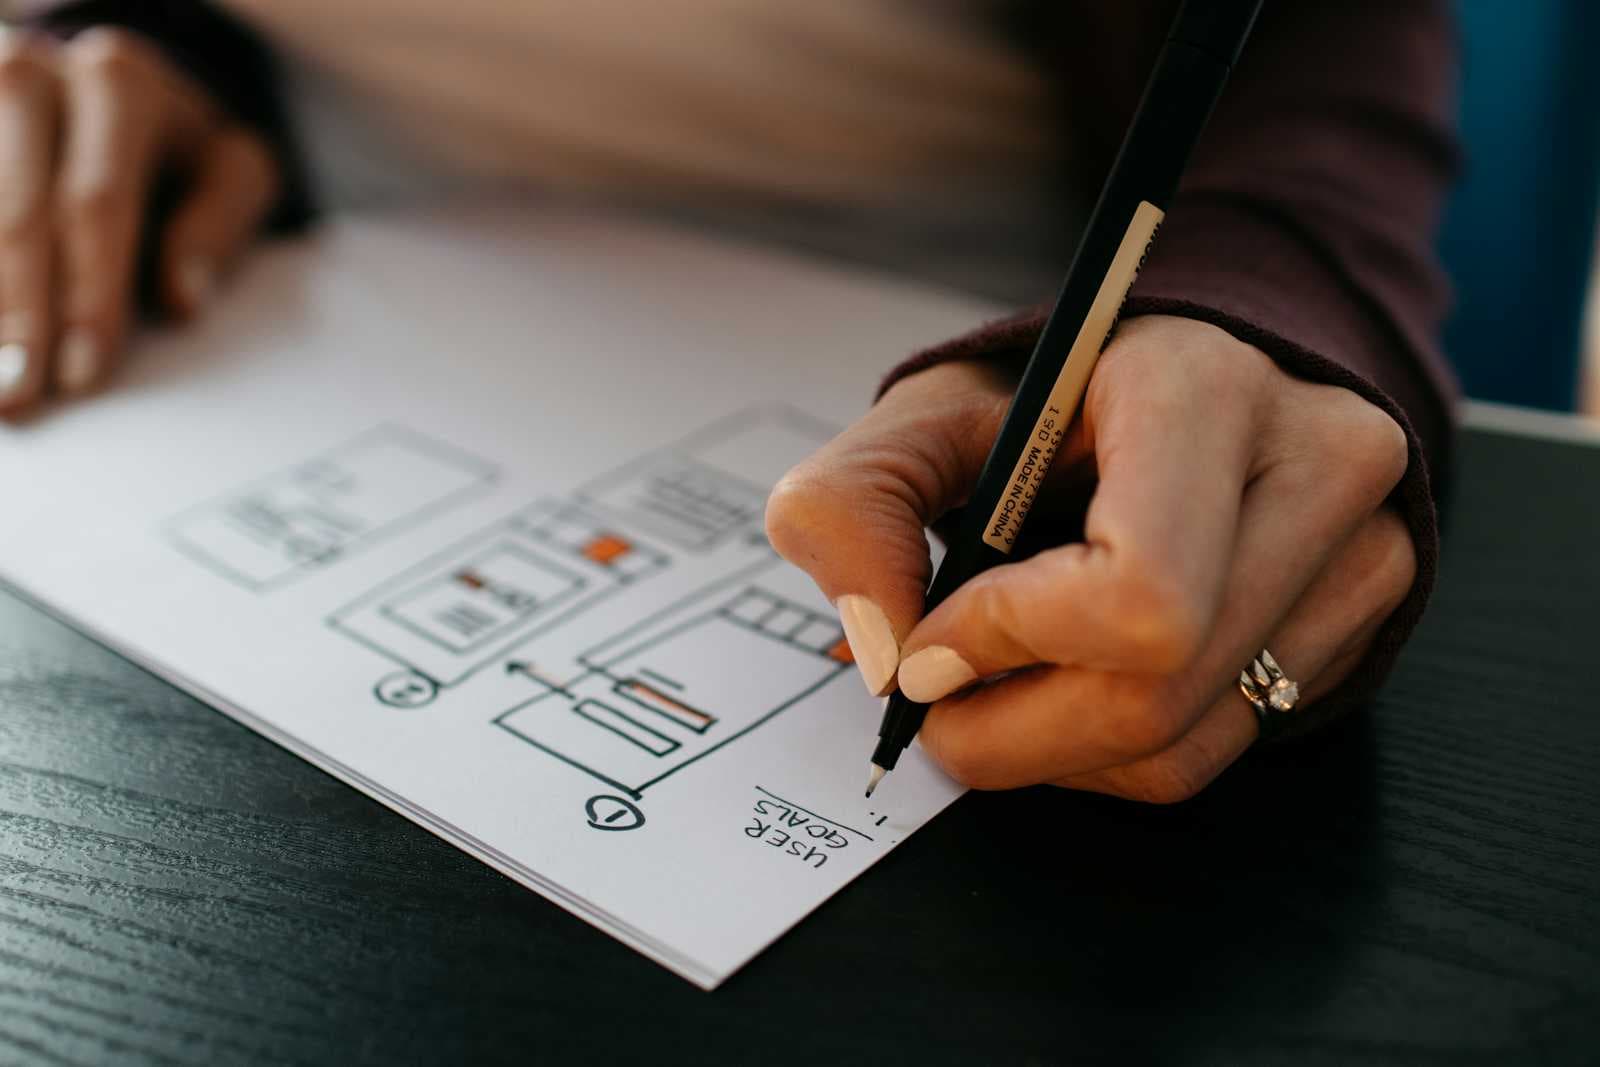
Let's be honest, getting started can be the hardest part. I've been wanting to build a project for a while, but I kept falling into the research rabbit hole. I'd brainstorm ideas, but none felt quite "sticky" enough to keep me motivated. This week, I decided to take a different approach. I revisited some old project ideas and found a way to combine two that sparked real interest!
The Project Takes Shape
The goal? A tool that visualizes conservation data – in this case, elephant conservation data – alongside collaborative features like real-time note-taking and data contribution. This feels like a project that combines my passion and skillset perfectly.
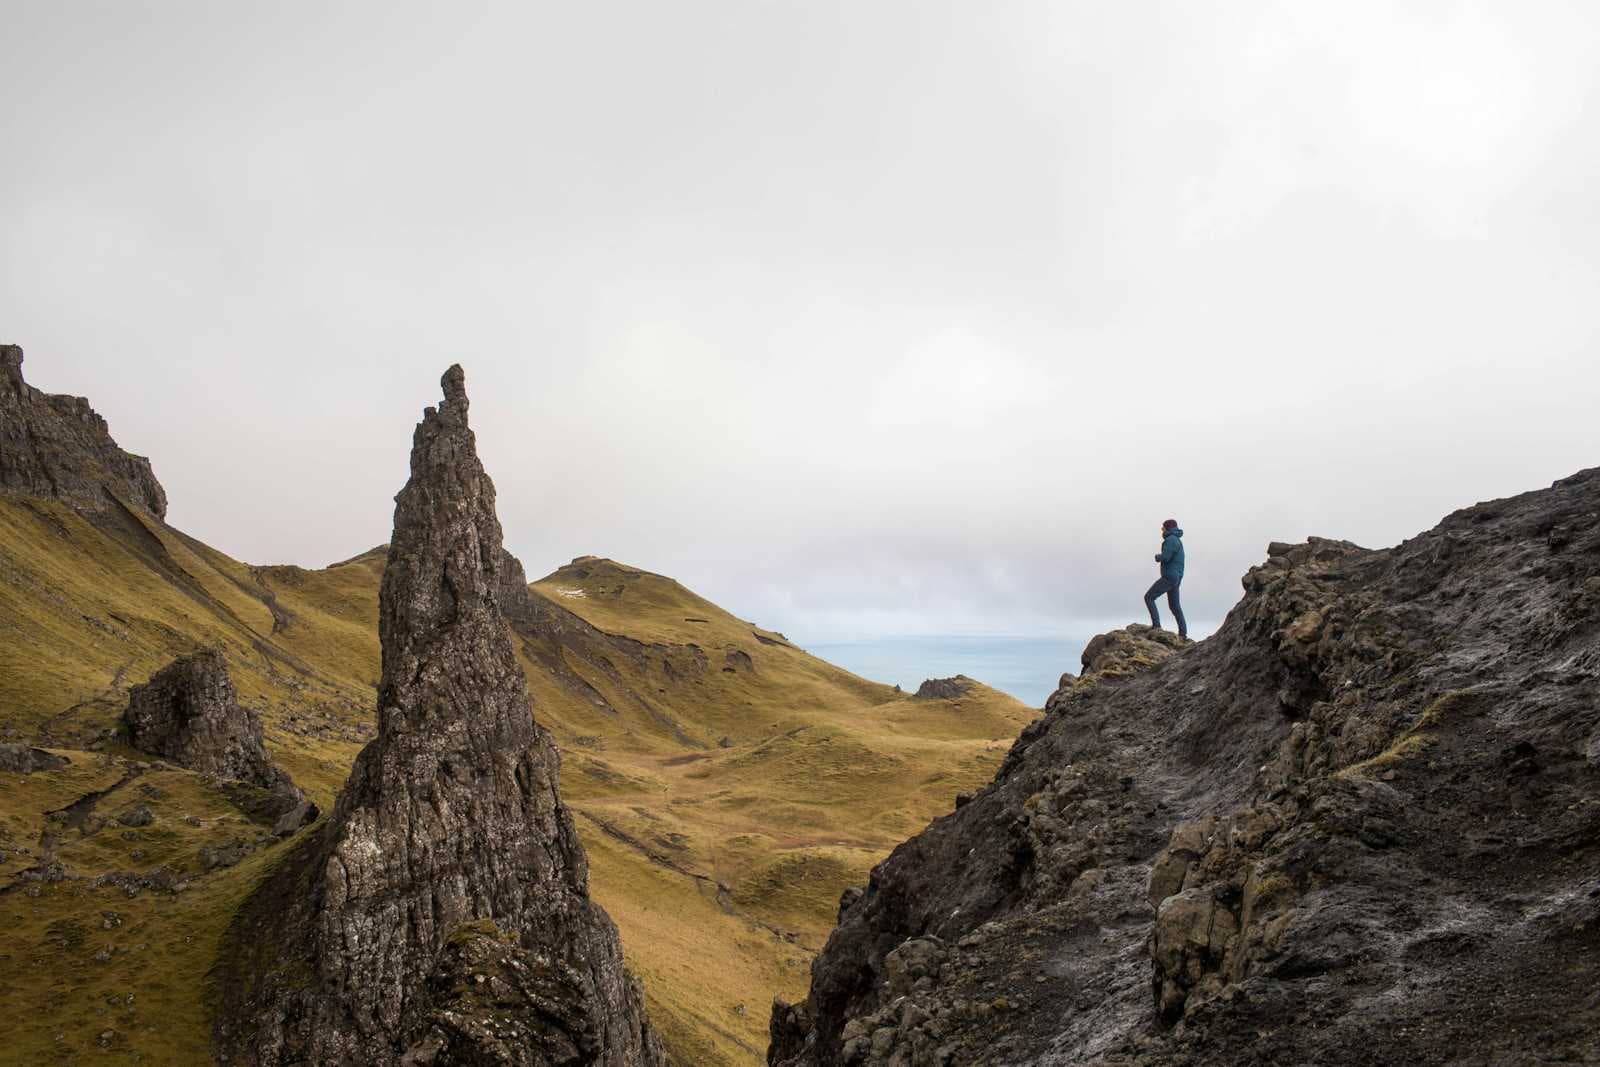
Of course, with any exciting idea comes a wave of questions. Data source? Data type? Should I focus on a specific species? Thankfully, I was able to narrow it down by focusing on elephants, a topic close to home (living close to where elephant-human conflicts are a growing concern).
Building the Foundation
This week wasn't just about brainstorming. I also got my hands dirty! Here's what I achieved:
Project Setup: I initialized the project, set up a database schema with Mongoose for MongoDB, and drafted the UI for key pages like the main map, visualization, and notes sections.
Time Management: Balancing work and personal life is key. I aimed for at least 10 minutes a day on the project, even if it was just to stay connected and maintain momentum.
Looking Ahead: Week 2
For the next week, my focus is UI development. I'll be diving into coding the interfaces for the main map and visualization screens. If I wrap that up early, I'll jump straight into integrating external data sources and getting that data displayed on the map.
Stay tuned for next week's update, where I'll share the progress on the UI and, hopefully, some exciting data visualizations!